This year the Massachusetts Division of Marine Fisheries estimated the second biggest river herring run in the history of the monitoring program: 589,924 +/- 74,087. This is the estimate that came out of the official monitoring program, where volunteers go to the dam and count “in-person” for 10-minute periods.
But as you readers all know, we also have a video counting program, which also generates an estimate, using a similar, but distinct statistical model.
And the video model—based on almost 10,000 counted videos out of a pool of 50,000 total videos—came up with a larger number: 759,668, +/- 18,865.
Why are they different?
First, note that the two models work in similar ways: They take sampling evidence (10-minute counts, counted videos) and then generate estimated average rates of fish passage (fish per minute) for given periods of time within a day. Then the models calculate daily estimated totals.
The two models generated substantially different estimated rates of fish passage, and thus different daily totals, at least for some of the days. Why?
One bit of research we did to investigate this question was thanks to all of you who participated in our data sprint. We had video counters count all the videos that corresponded to exactly the same 10-minute periods that in-person monitors observed fish. Here are the results:
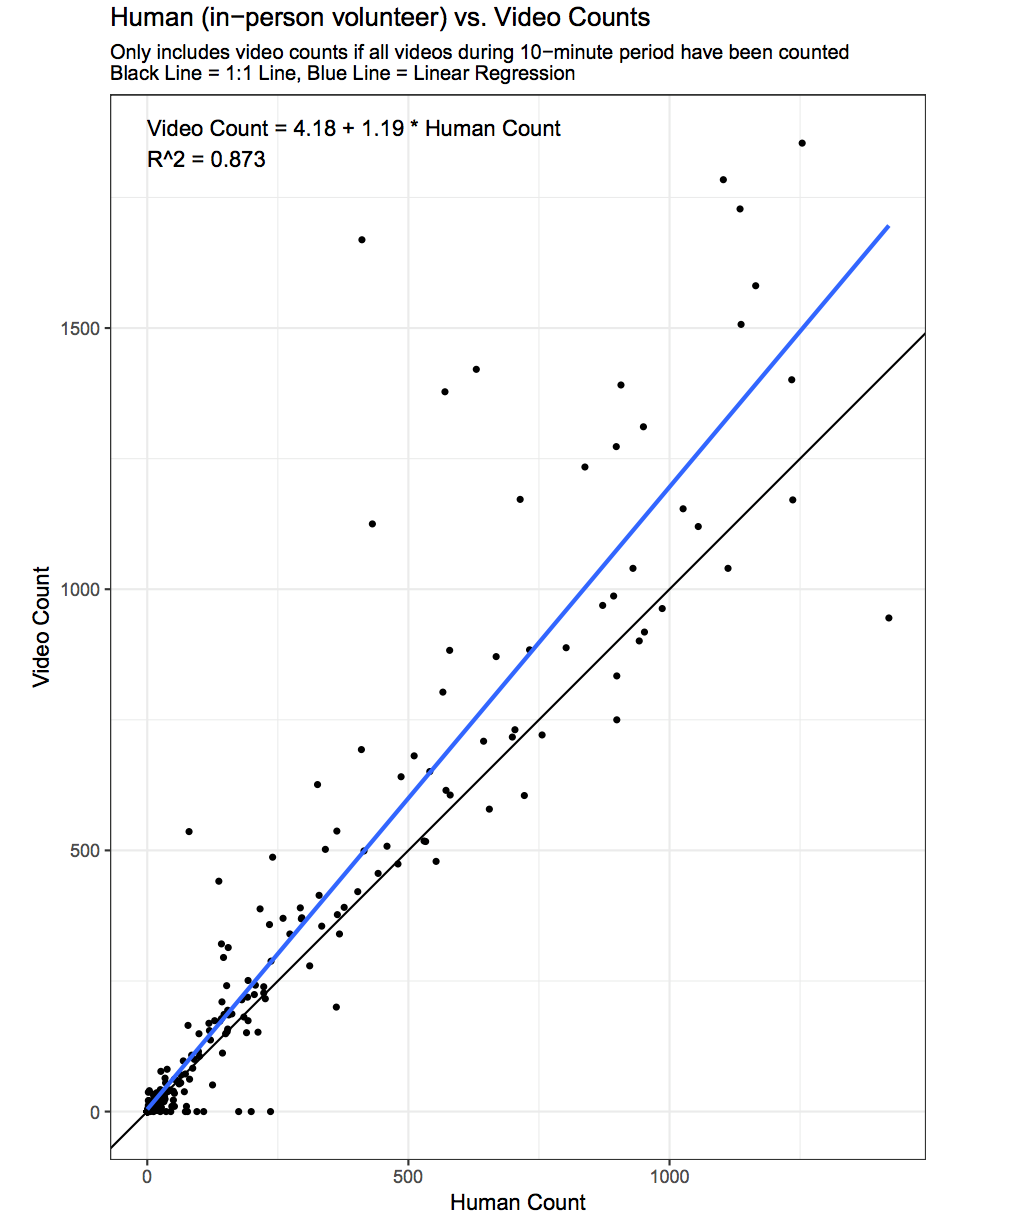
Each dot represents two numbers: the count made by the observer at the dam (horizontal axis), and the counts for the same period of time generated by our on-line video counters (vertical axis). A few points about this graph:
If all the counts were exactly the same, all the dots would have fallen on the black 1:1 line.
You would expect some variability in the data, just because observers’ recorded times may not agree exactly with the time periods recorded in the video system, for instance.
The relationship between the two sets of counts is really quite strong for this kind of observer data (reflected in the r-squared value of .87). In general, when video counts were low, in-person counts were low, and when video counts were high, in person counts were also high. Both counts were catching the action.
On average, video counts are a bit higher (1.2x higher) than in-person counts.
The biggest divergences between the counts come when the counts are very high, 500 fish in 10 minutes or more.
So we speculate that one factor causing the discrepancy is this: When fish were running very fast, in-person counters may underestimate the number of fish. It’s hard to count when fish are passing that quickly. The video counters have an advantage. They can slow down the video 2-10 times! Video may be a better way of estimating the fastest moments of the run.
(Interestingly when we did this analysis last year, video counts were systematically lower than in-person counts. But the water was very murky most of last season, and very clear this season. We believe this explains the difference between 2017 and 2018. )
A second factor that may help explain the difference between the two counts this year is that we had a bit of trouble staffing the in-person count this year. In 2017, we had more than 700 counted periods. In 2018, fewer than 500.
Here’s how that could lead to an underestimate. Consider May 26, the day with the second highest estimated passage according to the video model—more than 75,000 fish—and the biggest discrepancy between the two models’ daily estimates—more than 45,000. On May 26, we only had 3 out of 12 time slots counted in person, all in the morning. The way the model works, this means that all afternoon hours got an estimate of zero fish, when we know many thousands passed. The data gap leads to an underestimate, certainly on that day. (The discrepancies on just three days--May 16, May 18, and May 26--totaled more than 100,000 fish.)
So those are two factors—underestimates when rates are high, and a undersampling at key moments in the run—that may help explain why two modeled numbers are significantly different this year.
It’s all a great lesson in how models work. First, all models are estimates. And we should take very seriously the ranges; remember there is always uncertainty in these estimates. Second, any model is only as good as the data going in. If for some reason there are data gaps or biases in the data, the modeled result may reflect those. One lesson is the importance of full-day coverage when fish are running fast.
But we should hasten to say that BOTH our counting programs received high praise this year from the state. We continue to have one of the single most robust and well-supported programs in the state for fish counting. Because of this, the confidence in detecting trends over time (a slightly different statistical question) is extremely strong for the Mystic. So the big picture remains the same: we see continued strong evidence of a population that increased and is staying large.
This all is knowledge that only exists because of volunteer effort. That’s a remarkable story in itself.
Stay tuned for more next year. Thank you so much for your support and help in making this all possible.